Read the dashboard
Progress checklist
Overview
Section titled “Overview”The harness
Docker container on the lab EC2 instance that continuously GETs the same keys from Express and Standard, exposes a dashboard on :8080, and reports p50/p90 latency ratios. serves a small dashboard on port 8080. Continuous GETs against
the same hot keys produce latency percentiles for Express and Standard. The headline ratio is
Standard p50 ÷ Express p50 (higher means Express is faster on that percentile). Prefer the
ratio over absolute milliseconds from a quiet lab.
| Field | Meaning |
|---|---|
| Express p50 / p90 / p99 | GET latency for the directory bucket |
| Standard p50 / p90 / p99 | Same keys against the general-purpose bucket |
| Standard ÷ Express p50 | How many times slower Standard is vs Express at p50 |
| samples / errors | Rolling window (default 300s) plus cumulative errors |
export AWS_PROFILE=sandboxexport AWS_REGION=ap-southeast-2-
Open the dashboard — pick public IP or SSM port-forward to view on localhost.
Terminal window ./scripts/demo.sh dashLooks like (verified shape; IP is yours):
http://203.0.113.10:8080/Local view (SSM): ./scripts/demo.sh port-forward → http://127.0.0.1:8080/Open that URL in a browser. Security group ingress allows TCP 8080 (lab default
0.0.0.0/0).Requires the Session Manager plugin on your laptop and an instance role with
AmazonSSMManagedInstanceCore(see IAM and EC2). Leave the session running while you browse.Terminal window # optional: LOCAL_PORT=18080 ./scripts/demo.sh port-forward./scripts/demo.sh port-forwardLooks like (verified shape):
Forwarding remote :8080 → http://127.0.0.1:8080/ (Ctrl+C to stop)…Port 8080 opened for sessionId …Waiting for connections...Then open http://127.0.0.1:8080/ (or your
LOCAL_PORT). Equivalent raw CLI:Terminal window aws ssm start-session \--target "$(jq -r .instanceId .lab-state.json)" \--document-name AWS-StartPortForwardingSession \--parameters '{"portNumber":["8080"],"localPortNumber":["8080"]}' -
Wait until both series have enough samples (hundreds of GETs), then read the headline (Express is N× faster), the ms saved at p50, and the equal-scale race bars (Standard = full width). p50 / p90 / p99 stay in the two panels.
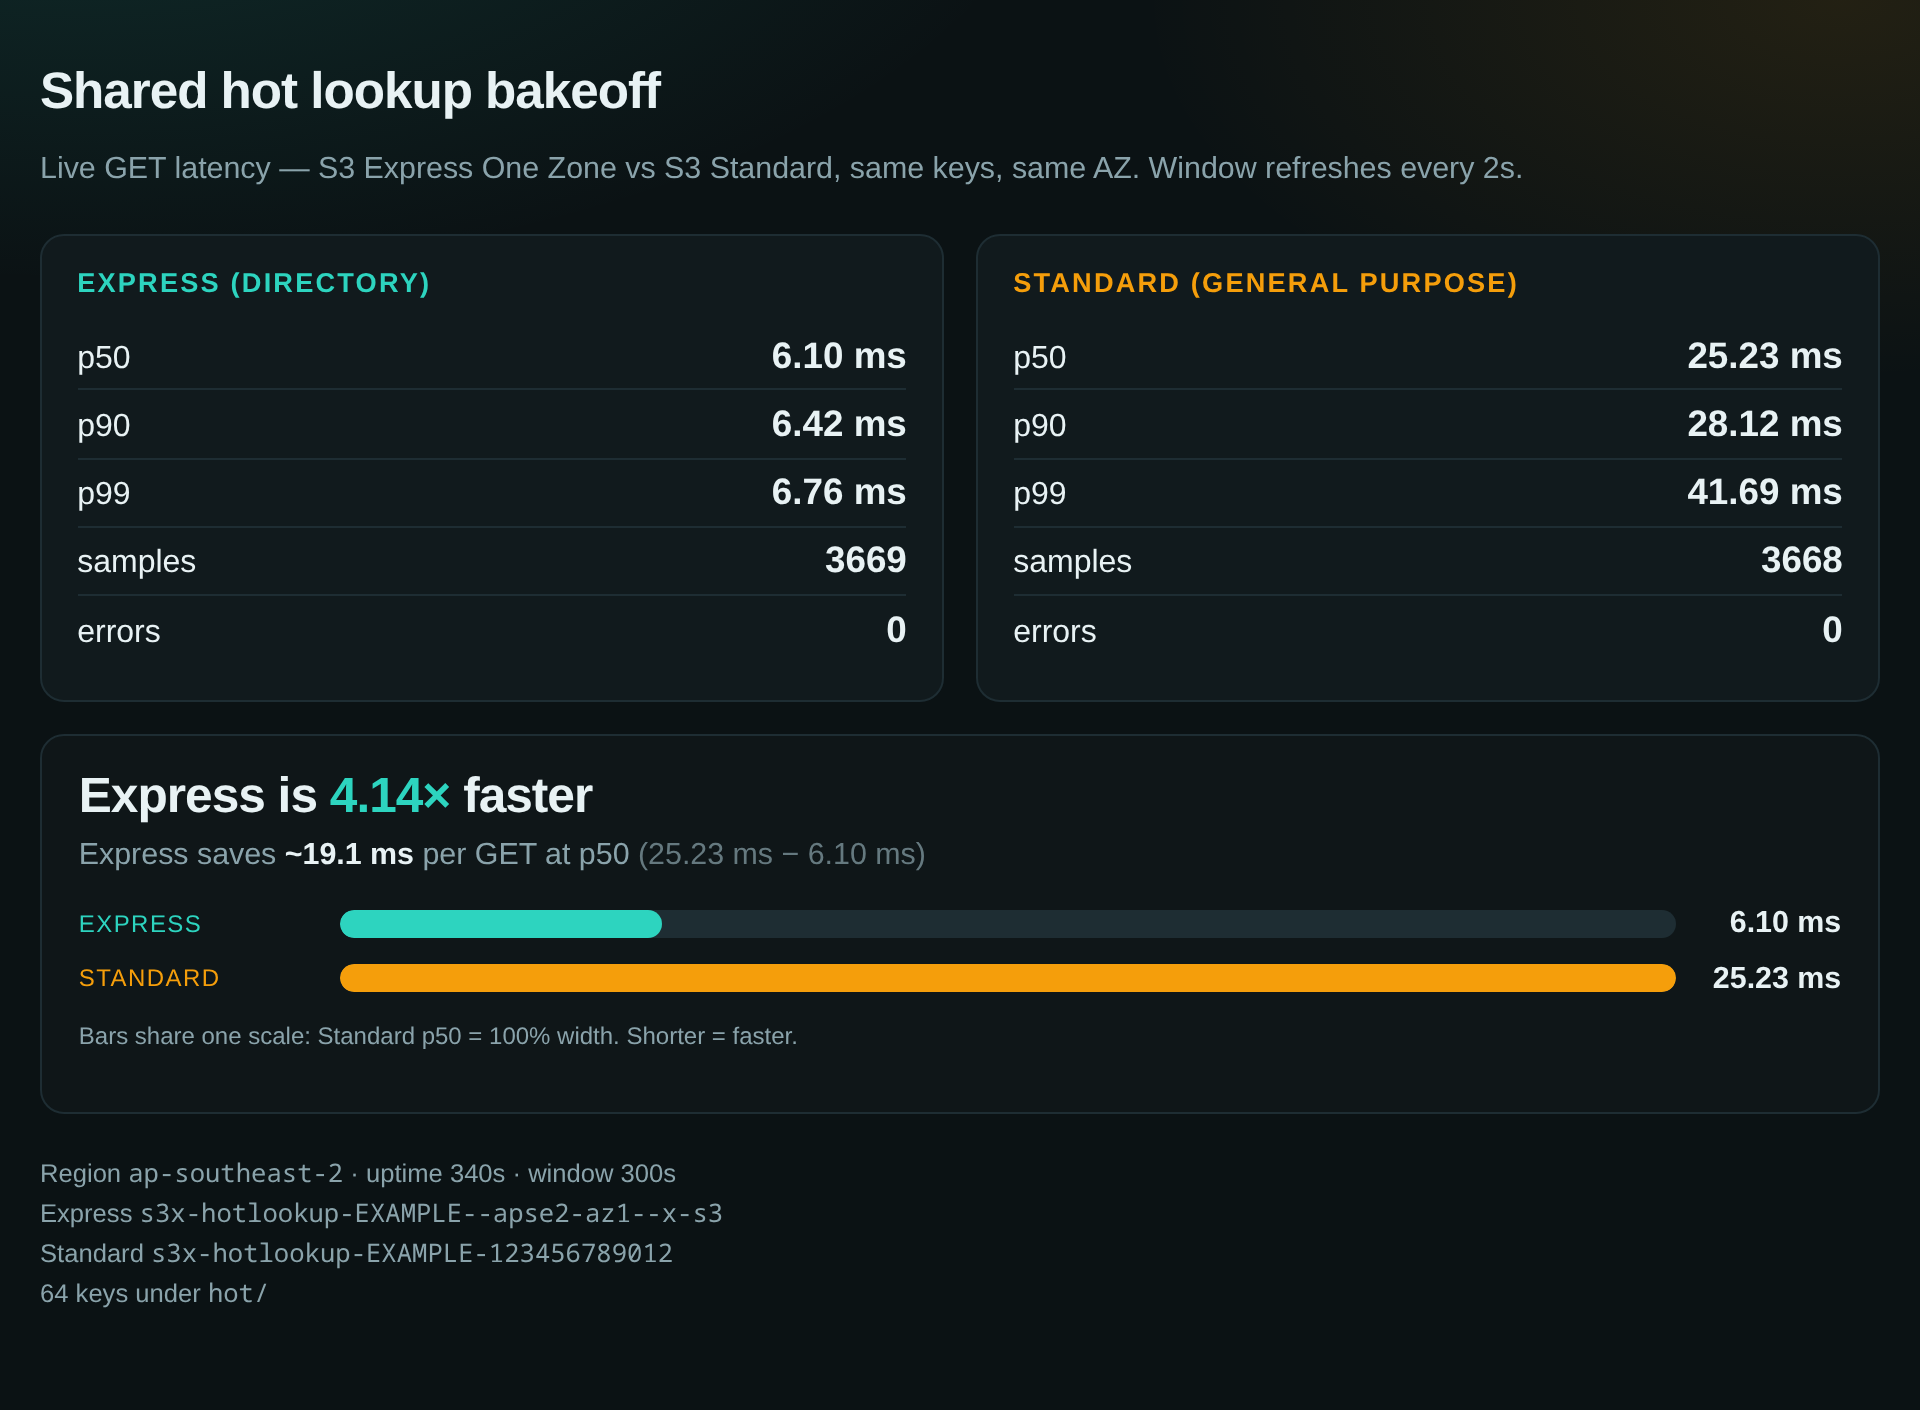
Live harness UI (this lab ≈4× at p50). Bucket suffix and account id are redacted.
-
Cross-check with CLI status and
/api/stats.Terminal window ./scripts/demo.sh statuscurl -sS "http://$(jq -r .publicIp .lab-state.json):8080/api/stats" | jq '{express: .express|{count,errors,p50_ms,p90_ms},standard: .standard|{count,errors,p50_ms,p90_ms},standard_over_express_p50}'Looks like (verified in this lab; your numbers will differ — cite the ratio, not a fixed ms claim):
{"express": { "count": 3671, "errors": 0, "p50_ms": 6.07, "p90_ms": 6.38 },"standard": { "count": 3671, "errors": 0, "p50_ms": 25.19, "p90_ms": 28.05 },"standard_over_express_p50": 4.15}Via port-forward, use
http://127.0.0.1:8080/api/statsinstead of the public IP.
Verify
Section titled “Verify”| Check | Expect |
|---|---|
| Dashboard HTML | Loads on :8080 (public or 127.0.0.1) |
| Sample counts | Climbing / non-zero in the rolling window |
| Errors | 0 on both sides after warm-up |
| Ratio | standard_over_express_p50 ≫ 1 when co-located (this lab ~4× at p50) |
| SSM forward | session-manager-plugin installed; get-connection-status → connected |
When finished, Tear down so On-Demand and storage charges stop. Then read Where Express fits before treating Express as production-only storage.